x
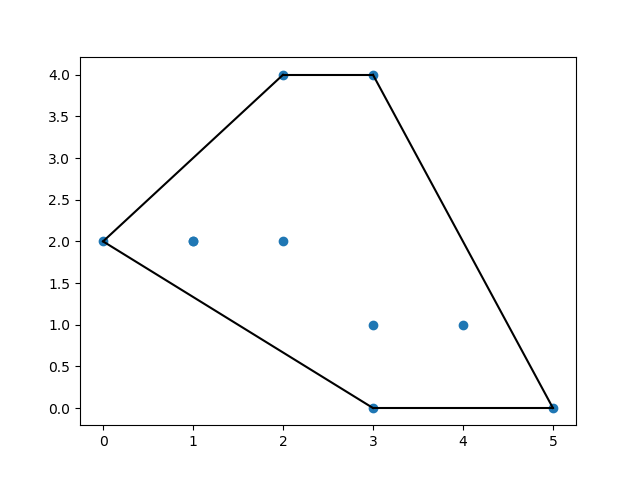
#Three lines to make our compiler able to draw:import sysimport matplotlibmatplotlib.use('Agg')import numpy as npfrom scipy.spatial import ConvexHullimport matplotlib.pyplot as pltpoints = np.array([ [2, 4], [3, 4], [3, 0], [2, 2], [4, 1], [1, 2], [5, 0], [3, 1], [1, 2], [0, 2]])hull = ConvexHull(points)hull_points = hull.simplicesplt.scatter(points[:,0], points[:,1])for simplex in hull_points: plt.plot(points[simplex,0], points[simplex,1], 'k-')plt.show()#Two lines to make our compiler able to draw:plt.savefig(sys.stdout.buffer)sys.stdout.flush()